Maven Unicorn Challenge
Link to GitHub repository, including data and final output.
About the dataset
Import data and data cleaning
Report layout planning
Visualisation design
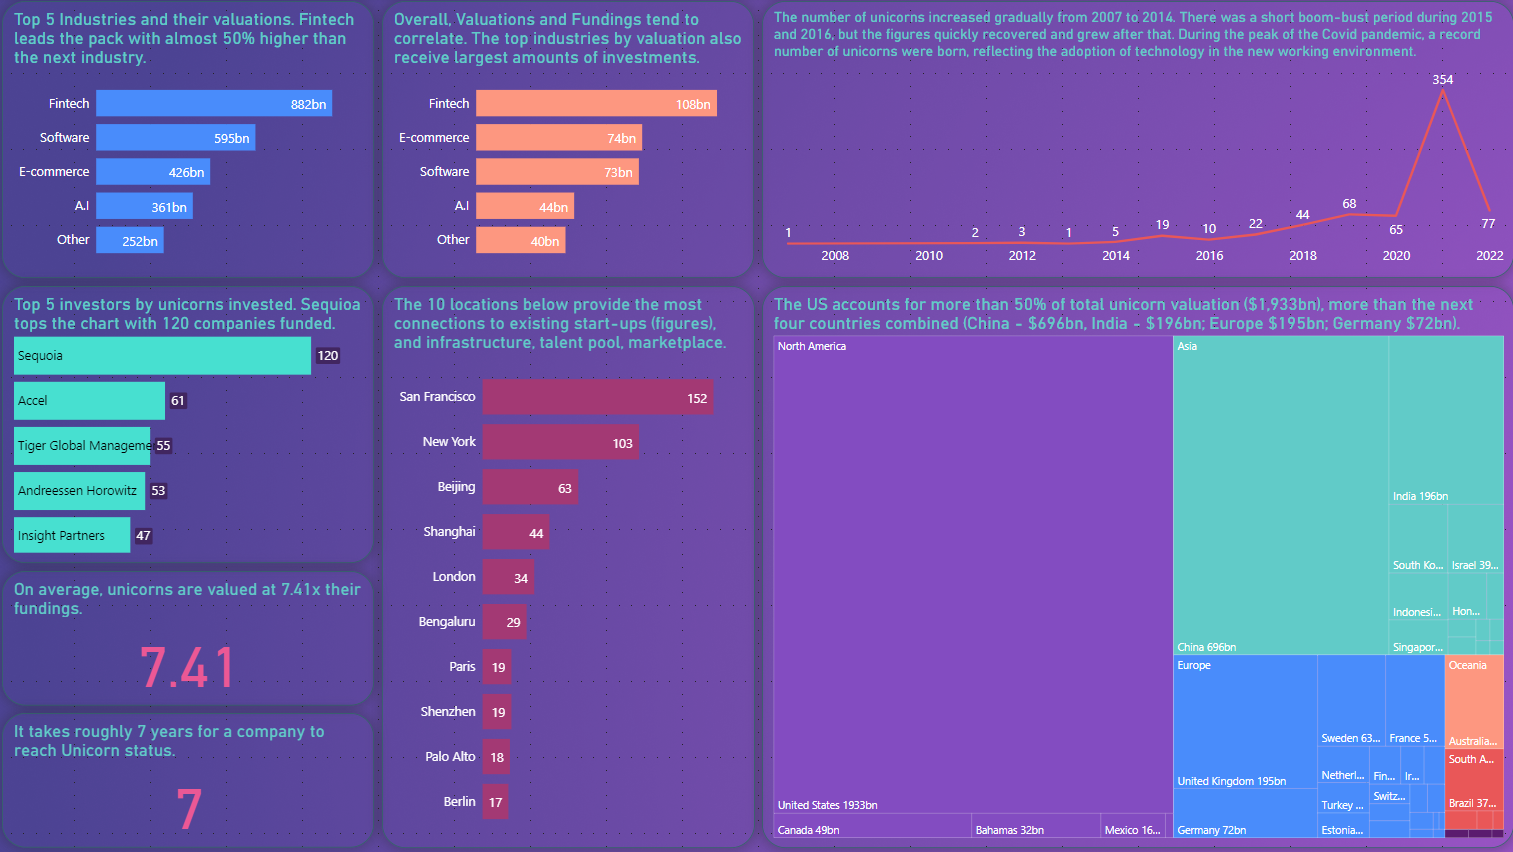
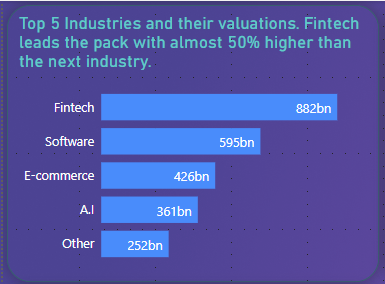
Valuation by industry
Visualisation - Stack bar chart
Y-axis: Industry; X-axis: Sum of Valuation
Filter: top 5 industries by Sum of Valuation
Insight: The datas act as an empirical evidence that technology-related unicorns create the most value, hence the top 4 categories are all in the tech field (Fintech, Software, E-commerce, AI).
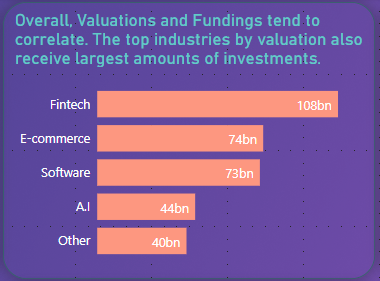
Funding by industry
Visualisation - Stack bar chart
Y-axis: Industry; X-axis: Sum of Funding
Filter: top 5 industries by Sum of Funding
Insight: Given the valuation of tech unicorns, there is no surprise that they also receive the most funding. Interestingly, E-Commerce and Software industries receive similar funding for unicorns but the valuation of Software unicorns is almost 40% higher than those of E-Commerce. Venture capitalists and Angel investors may take these rates of return into account when they assess future funding application. E-Commerce start-ups may find it harder to compete against Software start-ups for seed money.
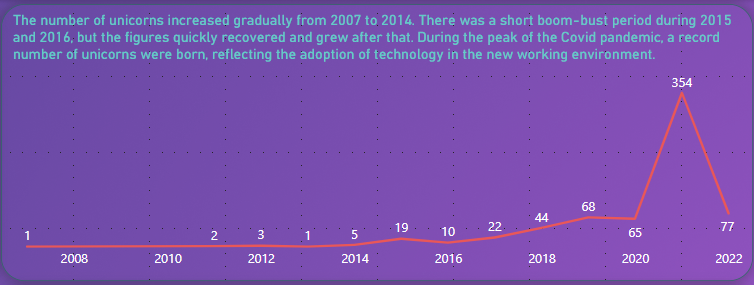
Unicorns joined by year
Visualisation - Stack bar chart
Y-axis: Count of Company; X-axis: Dated Joined - Year
Insight: When the COVID 19 pandemic hit, organisations around the world looked for solutions to help them operated with employees in isolation and social distancing orders. This created a massive demand in connectivity and health related start-ups. As a result, a huge number of unicorns are born during this period to meet the unfilled demand, boosting digital transformation projects.
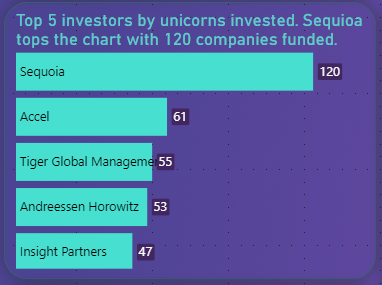
Investors by funded companies
Visualisation - Horizontal bar chart
Y-axis: Investor; X-axis: Sum of row counts
Filter: top 5 investors by Sum of row counts
Insight: When seeking for funding, start-ups may want to look at these investors first. Given the number of unicorns they are involved with, they can provide expertise in management, marketing, manufacturing, distribution in addition to funding. These are quite valuable for start-ups as they often lack the relevant capabilities, leading to early failures.
Valuation over funding ratio
Visualisation - Card
Value: New Measure
Valuation/Funding = SUM(
	Unicorn_Companies[Valuation]) /
	SUM(Unicorn_Companies[Funding])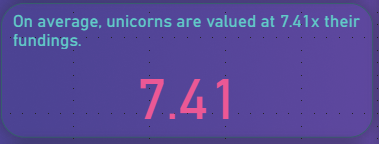
Time taken to reach Unicorn status
Visualisation - Card
Value: New Measure
Years to Unicorn = AVERAGEA(
	Unicorn_Companies[Year Joined]) -
	AVERAGEA(Unicorn_Companies[Year Founded])>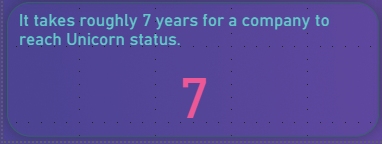
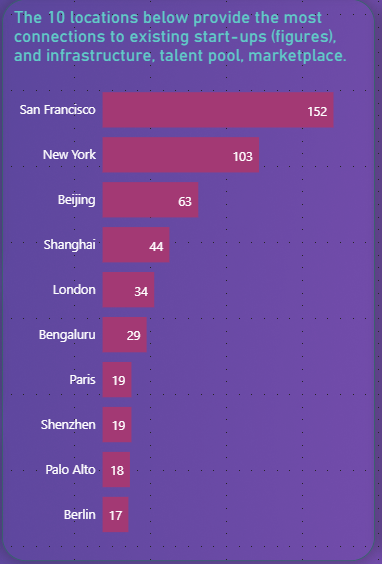
Companies by city
Visualisation - Stack bar chart
Y-axis: City; X-axis: Count of Company
Filter: top 10 cities by Count of Company
Insight: The USA provides the best environment for start-ups to thrive (strong legal system, establised investment environment, educated workforce). China is a good alternative due to the size of its domestic market.
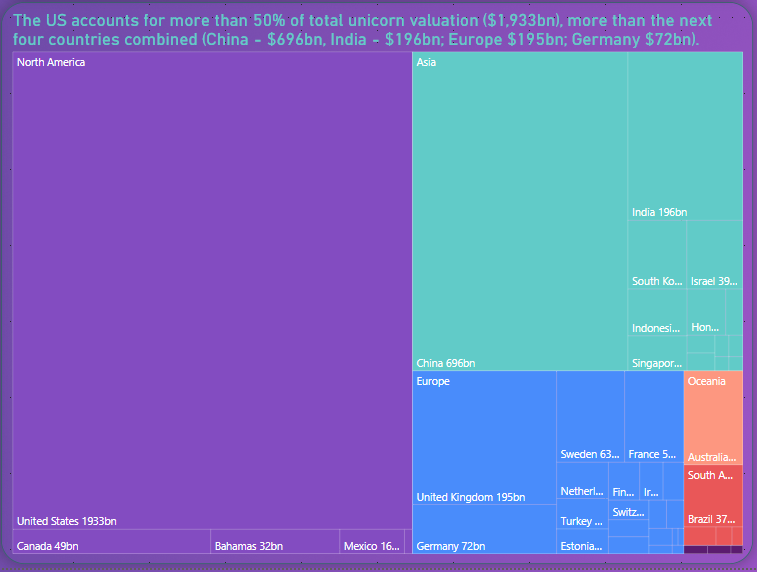
Valuation by Continent and Country
Visualisation - Treemap
Category: Continent; Details: Country; Value: Valuation
Insight: China is set to overtale the USA as the biggest economy in the world, according to some economists. However, the total size of its unicorn start-ups are dawrfed by the USA, which is a key indicator for creating values in the long-term. Hence, investing in the US economy still looks like a safer bet.